
Logistics and Supply Chain Animation: B2B Case Study
In the B2B SaaS enterprise market, clarity isn't just a design metric—it is a direct pipeline multiplier. When complex technology remains invisible, prospects default to inaction.
How ExplainerCue Engineered a High-Converting Visual Framework for GLS’s Secure Data Logistics Network
When marketing enterprise-level risk mitigation tools, the challenge doubles. You aren't just fighting competitors; you are fighting the dense, technical friction of predictive algorithms, automated multi-bureau ledger loops, and abstract backend background security mechanics. This case study breaks down how ExplainerCue took a highly complex backend data mechanism—GLS’s cross-border predictive analytics and tracking platform—and translated it into a high-converting logistics and supply chain animation asset built for 2026 enterprise buyers.
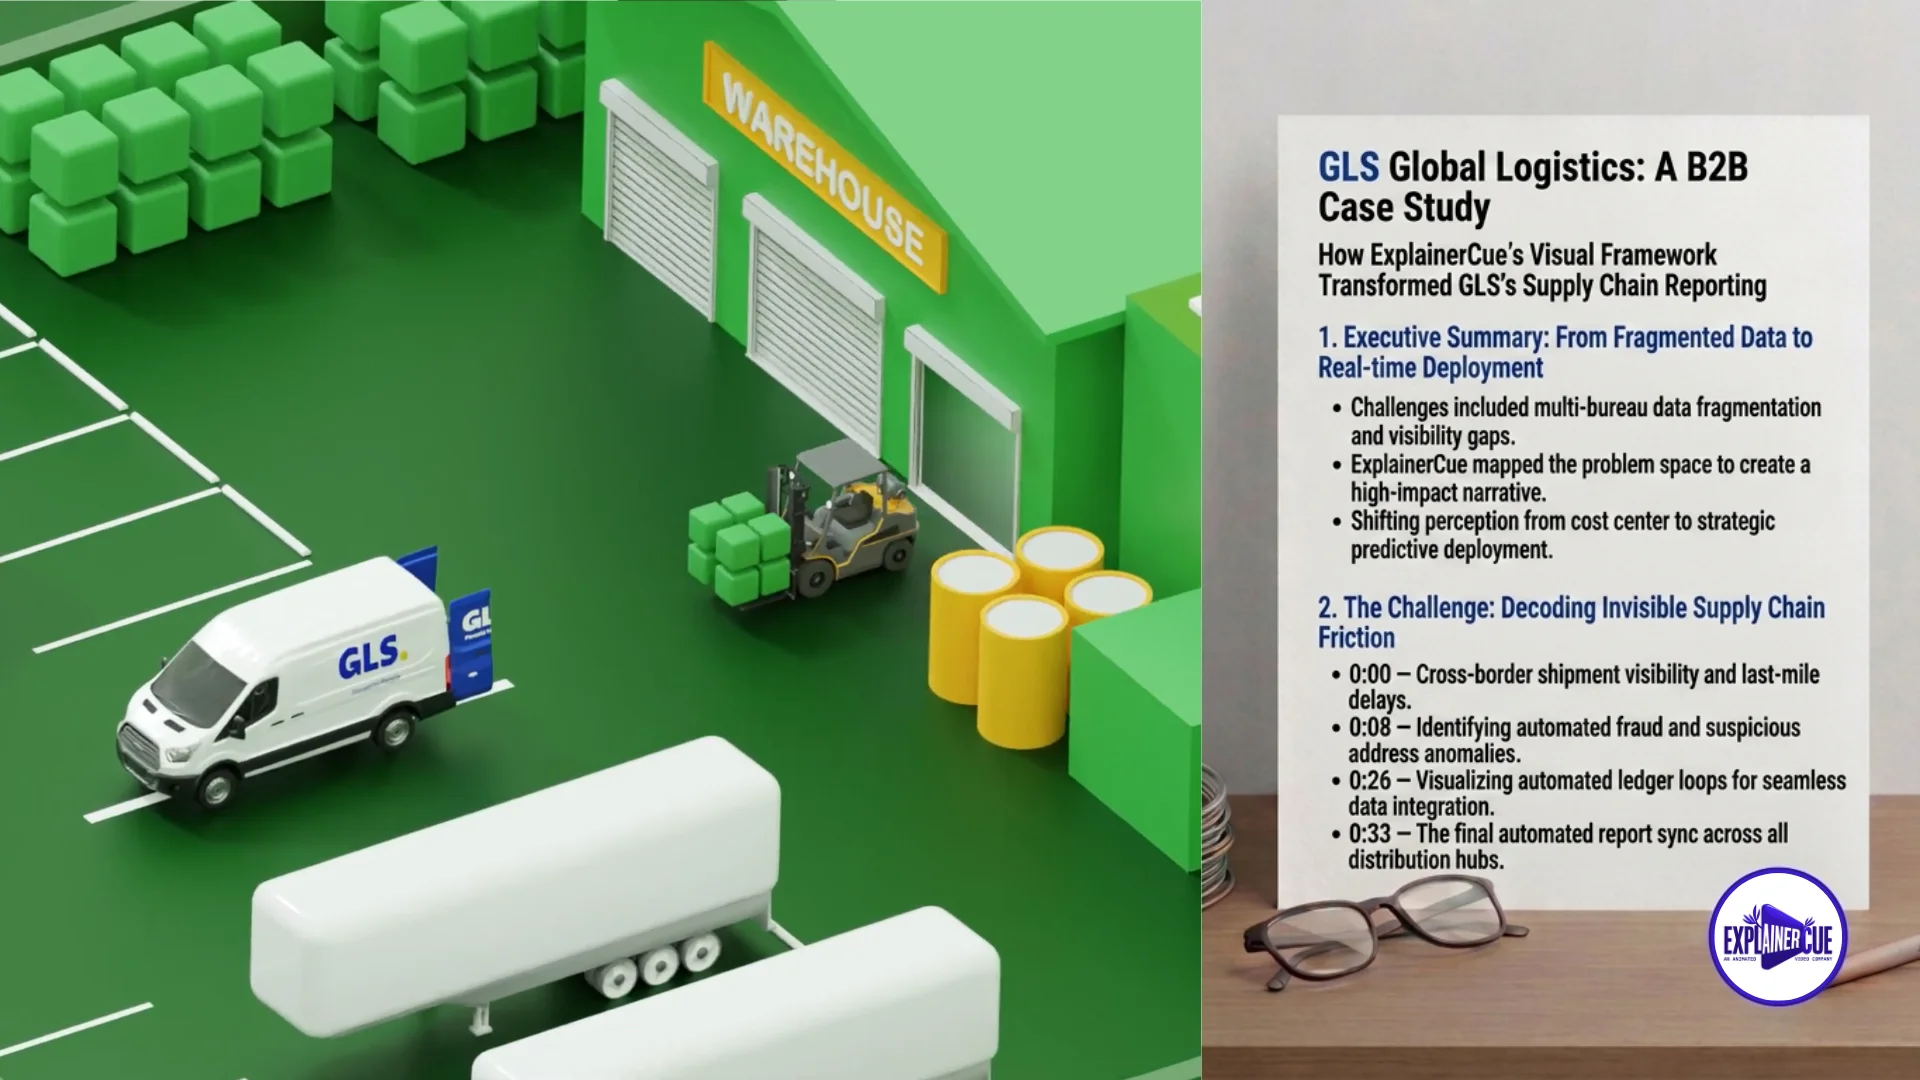
1. Executive Summary: Shifting from Technical Friction to Instant Deployment
Enterprise software launches often stall because marketing messaging targets executive check-signers using engineer-level language. This disconnect creates a severe friction point in the user acquisition funnel.
GLS entered the market with a brilliant premise for its Trust Courier system: stopping cross-border parcel risk directly at the database level. However, initial explanations relied heavily on dry logistical text, complex compliance text, and dense architectural data diagrams. ExplainerCue reconstructed this narrative into a high-retention video asset. By converting dry tracking algorithms into a physical, high-stakes visual metaphor, we successfully shifted target user perception from "this is another costly logistical backend" to "this is an essential predictive security deployment."
2. The Challenge: Decoding the "Invisible Asset Risk" Dilemma
Modern logistical and data threats are largely invisible. Most Operations Managers and CTOs understand traditional transport lines, but explaining sophisticated predictive vectors like automated address fraud or pattern-based risk modeling via text is incredibly difficult.
The core internal challenge was outlining the specific progression of an operational vulnerability before it manifests physically:
- 0:00 — Cross-border shipping errors directly eroding small business reputation and consumer trust.
- 0:08 — The sudden financial blind spots created by last-mile reclamations and package losses.
- 0:33 — High-value corporate parcels deviating onto unusual routes or suspicious addresses.
- 0:50 — The difficulty of tracking recurring delivery issues across vast, unmonitored geographic borders.
Relying on traditional static whitepapers or rigid raw screen recordings simply failed to capture user attention. In a distracted B2B environment, forcing a busy technical director to read a multi-page analysis just to understand a core feature actively harms user acquisition. We needed a visual format that could bridge this knowledge gap in under thirty seconds.
3. The Solution: ExplainerCue’s Semi-Isometric Creative Architecture
Instead of falling back on uninspired corporate stock footage or abstract 2D icon shapes, ExplainerCue engineered a customized semi-isometric motion design framework. We transformed the abstract concept of a cloud infrastructure database into a literal, physical "Secure Gateway" within a global enterprise map. This simple visual metaphor allowed non-technical executives to immediately visualize the exact mechanics of data-driven risk prevention.
Custom Color Strategy & Asset Engineering
- Enterprise Trust Tones: We established a base color palette using cool, high-contrast greys and deep corporate blues to reinforce operational safety, institutional security, and authoritative trust.
- High-Visibility Alert Highlights: We introduced stark, vibrant red accent tracking indicators to instantly direct the viewer’s eye to unauthorized route deviations and fraudulent address anomalies.
Instead of generic pre-made assets, every single element was carefully optimized from scratch. For modern platforms looking to build out an authoritative video library, utilizing a custom SaaS product demo video services framework ensures your core technical differentiators are instantly recognizable.
4. The Structural Narrative: Mapping Video Timestamps to User Psychology
To maximize retention and drive direct user action, we mapped the video's pacing directly to the target buyer's emotional and analytical journey:
- Phase 1 (The Threat Matrix): We hook the viewer by exposing the modern financial danger of asset loss. By showing an operator effortlessly tracking cross-border vulnerabilities, we eliminate any false sense of security.
- Phase 2 (The Structural Pivot): Using our 2D Isometric Explainer Deep Dive structure, we visually track an evolving database isolating a malicious node, making an invisible cloud exploit instantly clear.
- Phase 3 (The Friction-Free Resolution): The narrative introduces the system as the ultimate alert sentinel, concluding with a simple, high-converting call to action showing a friction-free enterprise deployment.
5. The Business Outcome & Lessons Learned
By treating this logistics and supply chain animation as a strategic sales engine rather than just a quick marketing piece, the project unlocked major pipeline efficiency:
- Reduced Sales Friction: Mid-market sales teams no longer spent the first fifteen minutes of a live discovery call explaining how predictive network loops work.
- Clear Onboarding Expectations: Showcasing the real-time database setup process lowered technical hesitation, driving a major spike in system configuration requests.
- Enhanced Brand Authority: Transitioning away from generic stock assets to a custom isometric design helped establish the brand as a premium leader in secure data logistics.
The primary lesson for any scaling B2B company is clear: when communicating complex product ecosystems, do not force your audience to guess how your product works. When you present clear Isometric Design for Tech Products, you completely eliminate user confusion and clear a straight path to a purchase decision.
To see how top-tier software brands format these complex visual frameworks to capture maximum market share, check out our blueprint analysis on the Top Explainer Video Production Companies.
Turn Your Complex Software into a High-Converting Sales Engine
Are you ready to stop losing valuable enterprise deals to complex messaging and low user engagement? Let’s transform your intricate backend code into a powerful, high-converting visual asset.
Book a Free Video Strategy Audit with ExplainerCue Today →